Command
The Command application is a productivity tool that allows you to quickly access to the most common actions on Aquarium.
To open the Command application, you can use those shortcuts:
SHIFT + :(the/key)CTRL + K(orCMD + Kon Mac)SHIFT + K
From the studio interface, you can also click on the icon.
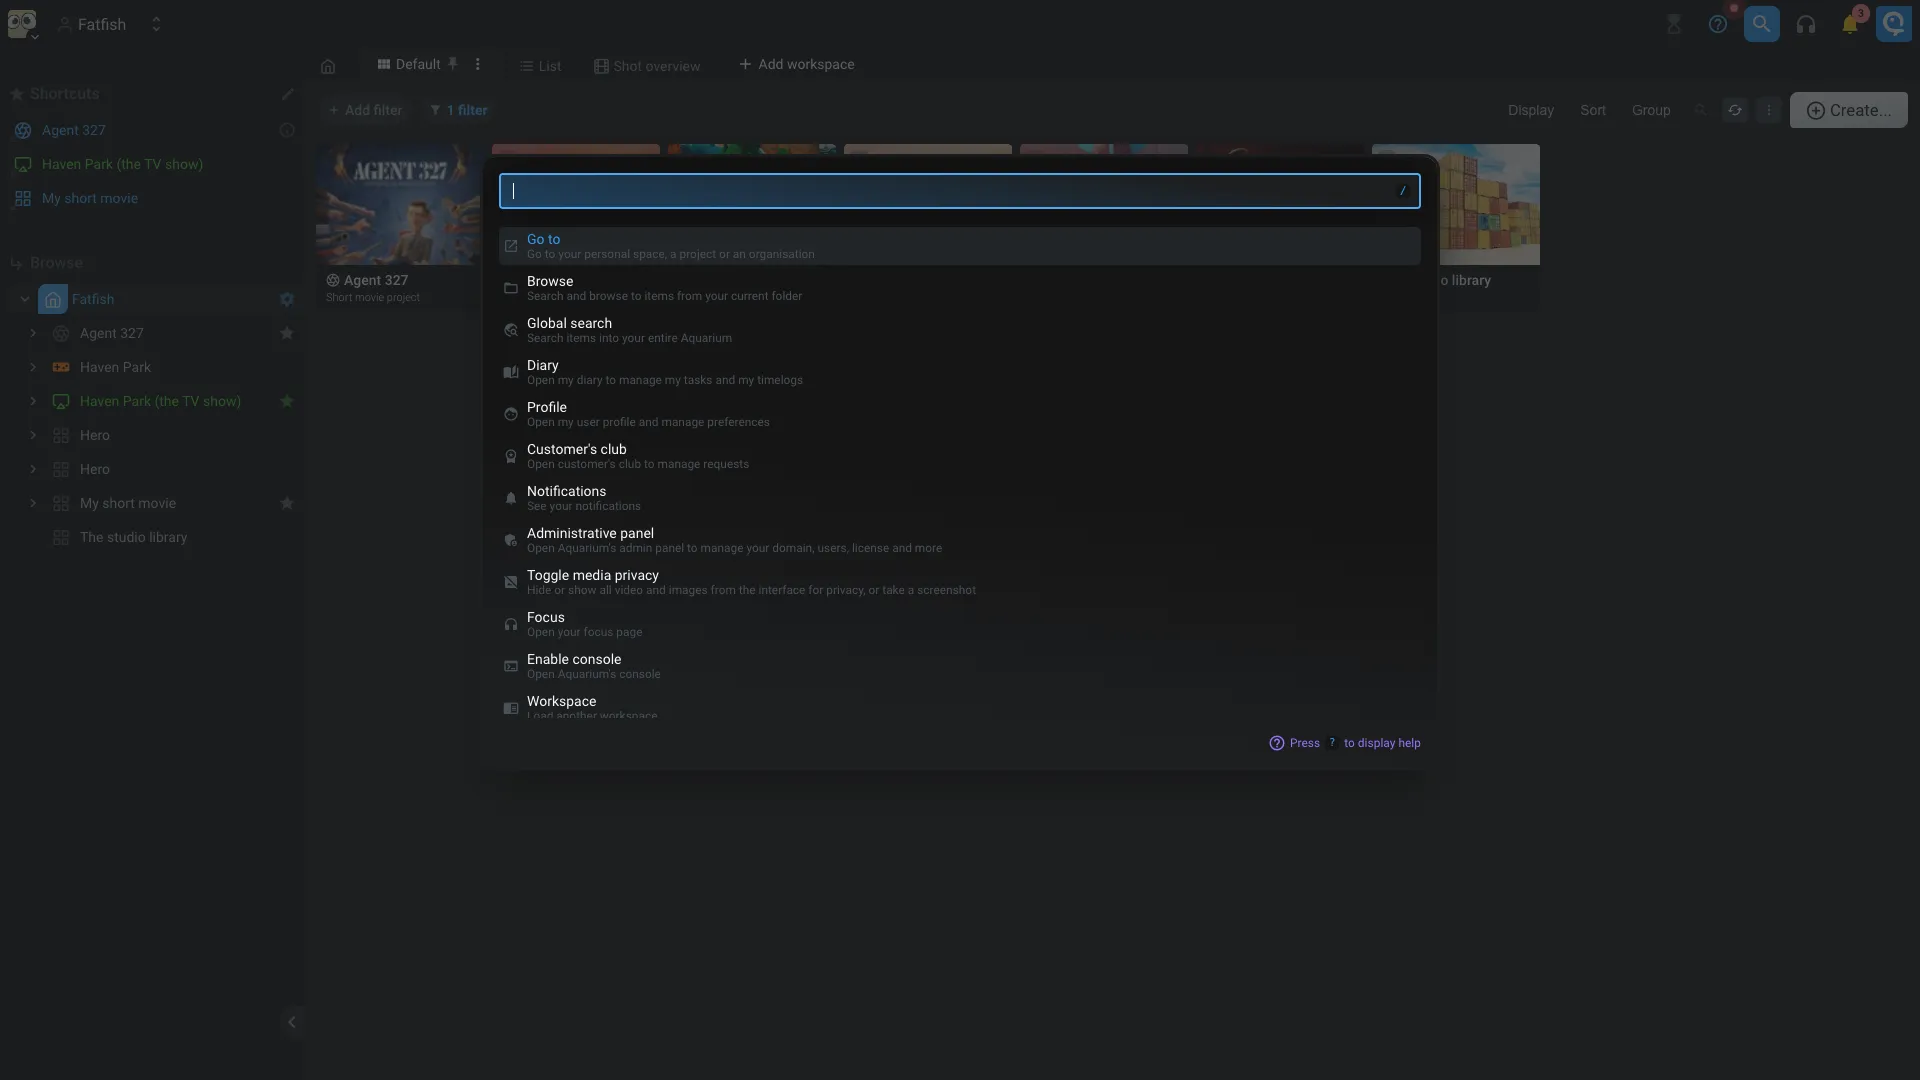
The available commands are:
| Command | Description |
|---|---|
| Go to | Go to your personal space, a project or an organisation |
| Browse | Search and browse to items from your current folder |
| Global search | Search items into your entire Aquarium |
| Diary | Open my diary to manage my tasks and my timelogs |
| Profile | Open my user profile and manage preferences |
| Customer's club | Open customer's club to manage requests |
| Notifications | See your notifications |
| Administrative panel | Open Aquarium's admin panel to manage your domain settings, users, license and more |
| Toggle media privacy | Hide or show all video and images from the interface for privacy, or take a screenshot |
| Performance observer | Open the performance observer to monitor the time of each requests |
| Focus | Open your focus page |
| Enable console | Open Aquarium's console |
| Workspace | Load another workspace |
| ? | Open the help panel |
You can use the arrow keys to navigate through the list of commands and press ENTER to execute the selected command.
Console (the nodal explorer)
The console is a powerful tool that allows you to explore the content of your Aquarium in a nodal way.
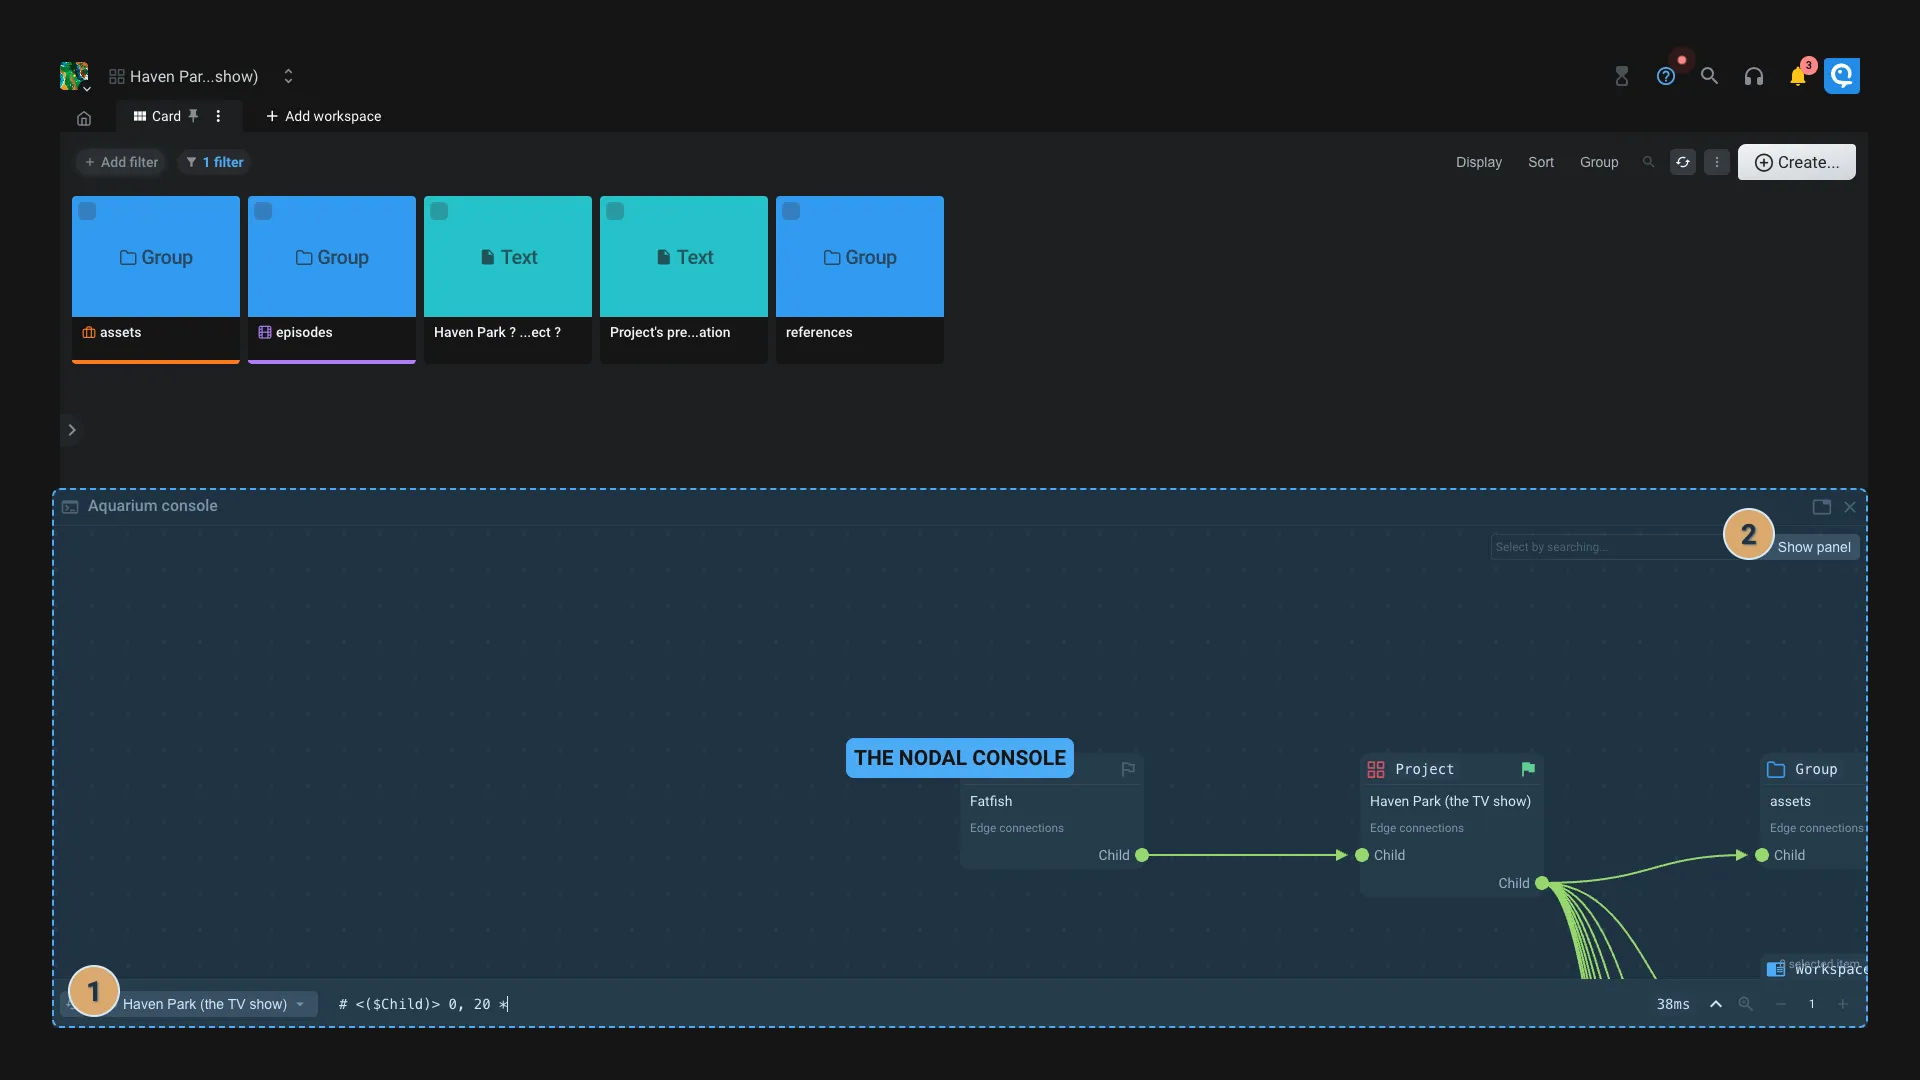
- Browse: From the console you can browse your items using a nodal interface. Click on the icon to use this item as the starting point of the query.
- You can also enter the _key of the item by clicking on the button.
- View item/edge data: By clicking on an item, you can see its data and metadata using the right panel. You can also do the same by selecting an edge.
- Enable edition: By default the console is in read-only mode. You can enable the edition by toggling the switch on the top right corner.
- When edition is enabled you can create new connection between items by dragging from "New edge" entry onto the target item. Once the dropping is done, a dialog wheel appear so you can select the edge type you want. Use the
Other...to create a custom edge type. - In the right panel, a new button appears to trash an item or delete an edge.
- When edition is enabled you can create new connection between items by dragging from "New edge" entry onto the target item. Once the dropping is done, a dialog wheel appear so you can select the edge type you want. Use the
Performance observer
The performance observer is a tool that allows you to visualize the time of each request made by the interface.
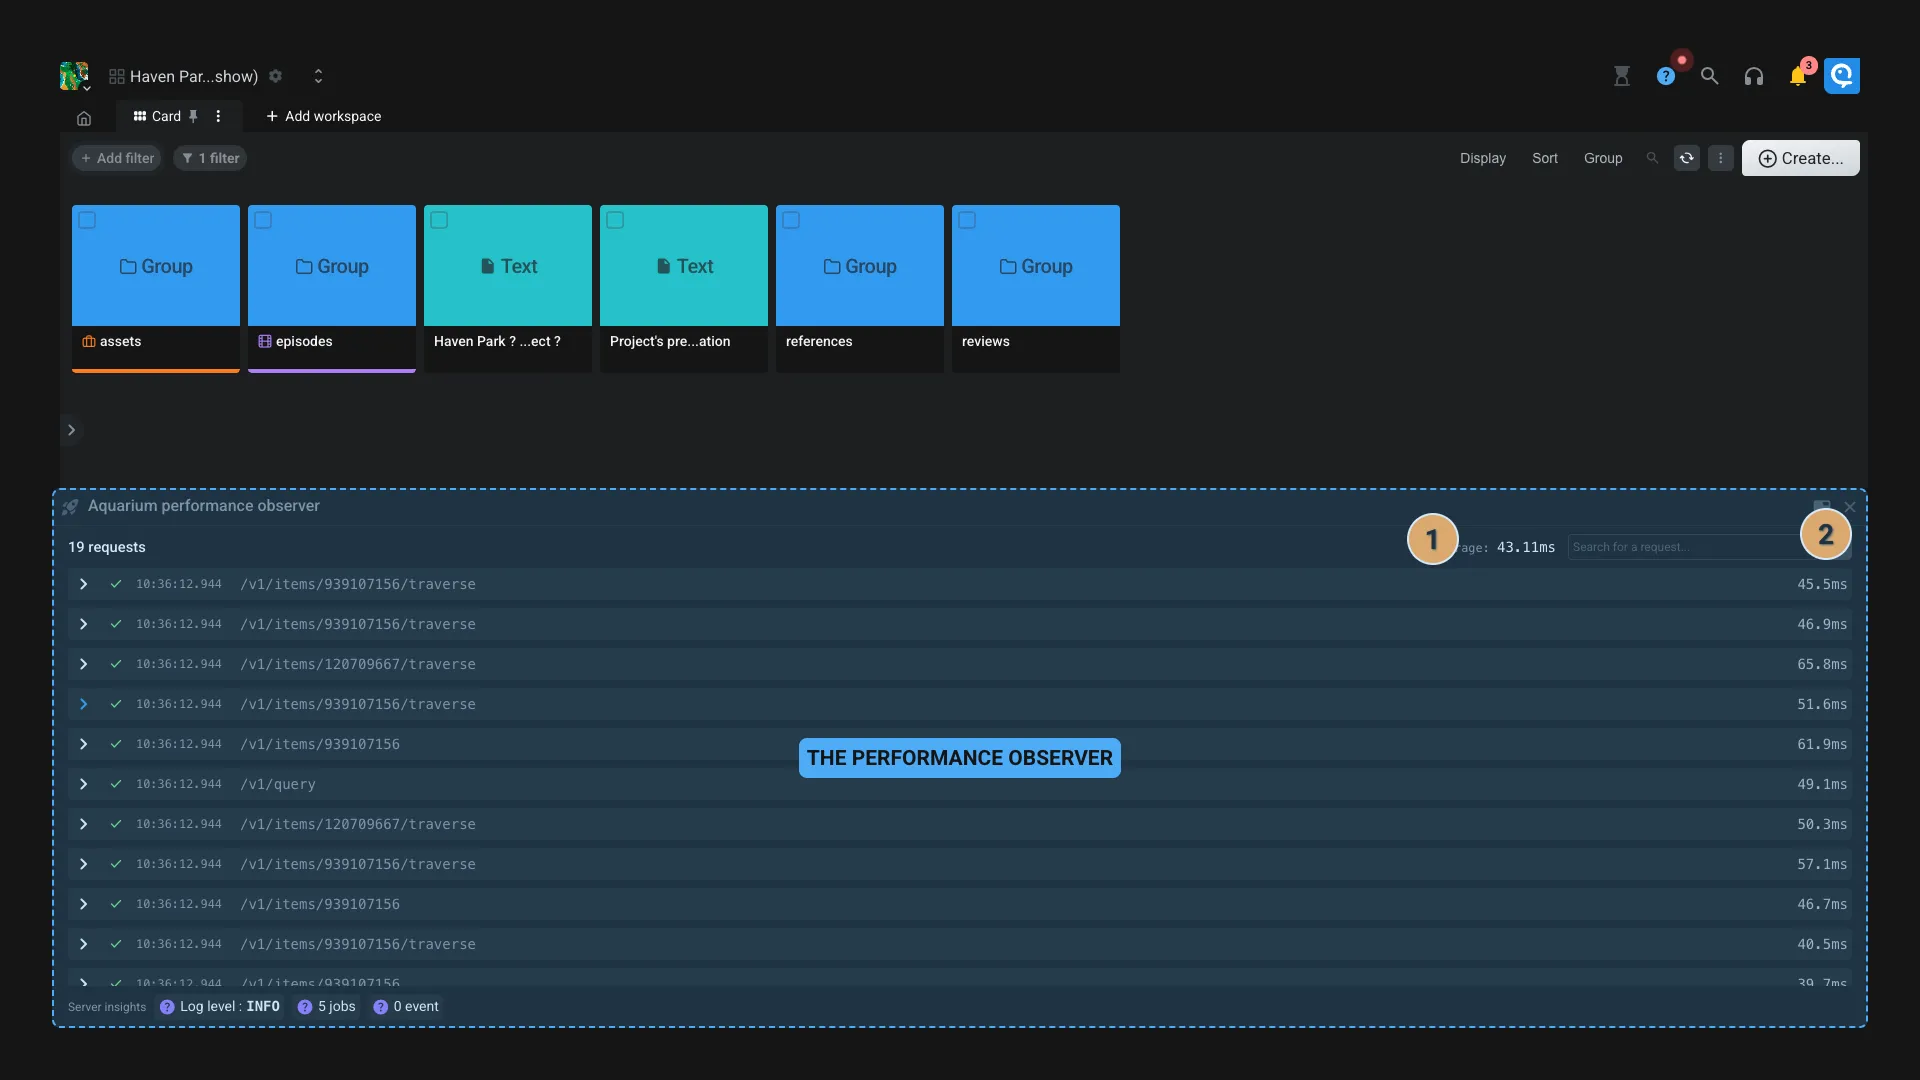
If enabled on Aquarium's server configuration, you will be able to see the time of each process that happen on the backend. If this option is not enbabled, you only have access to the global time of the request.
- Average time: The average time of all the requests. Hover this options to see the average time of each processes.
- Options:
- Export: Export the data as a JSON file for further analysis. You can send this file to Fatfish Lab support if requested. Note that this file doesn't contain any sensitive data (like project names, images, credentials, etc).
- Clear: Clear the data from the observer.
To import an exported data, you can drag and drop the file into the observer.