Action editor
The action editor is the application used to edit Action item in Aquarium.
An action is used to automate process. It's with this system that you can send notifications to users, set automatic status changes, etc. Some examples are available in the add menu as templates. You can also checkout our how-to guides.
The goal of an action is to listen for a specific event's topic and execute the associated Operations.
When you create an action, look at the templates available in the add menu to discover some examples. Some of them are ready to use !
Operations
In the sidebar, you can see the full list of the available operations.
At the end of the sidebar, you have special nodes :
- You can create notes in the interface, to add some comments or explanations.
- You can also regroup operations in a group node. It's useful to organize your action, make it more readable and reusable.
- You can also import an existing group.
If you think that an operation is missing, let us know ! We will be happy to add it to the list.
Click on an operation to add it to the action. You can also grab it and drop it in the action interface.
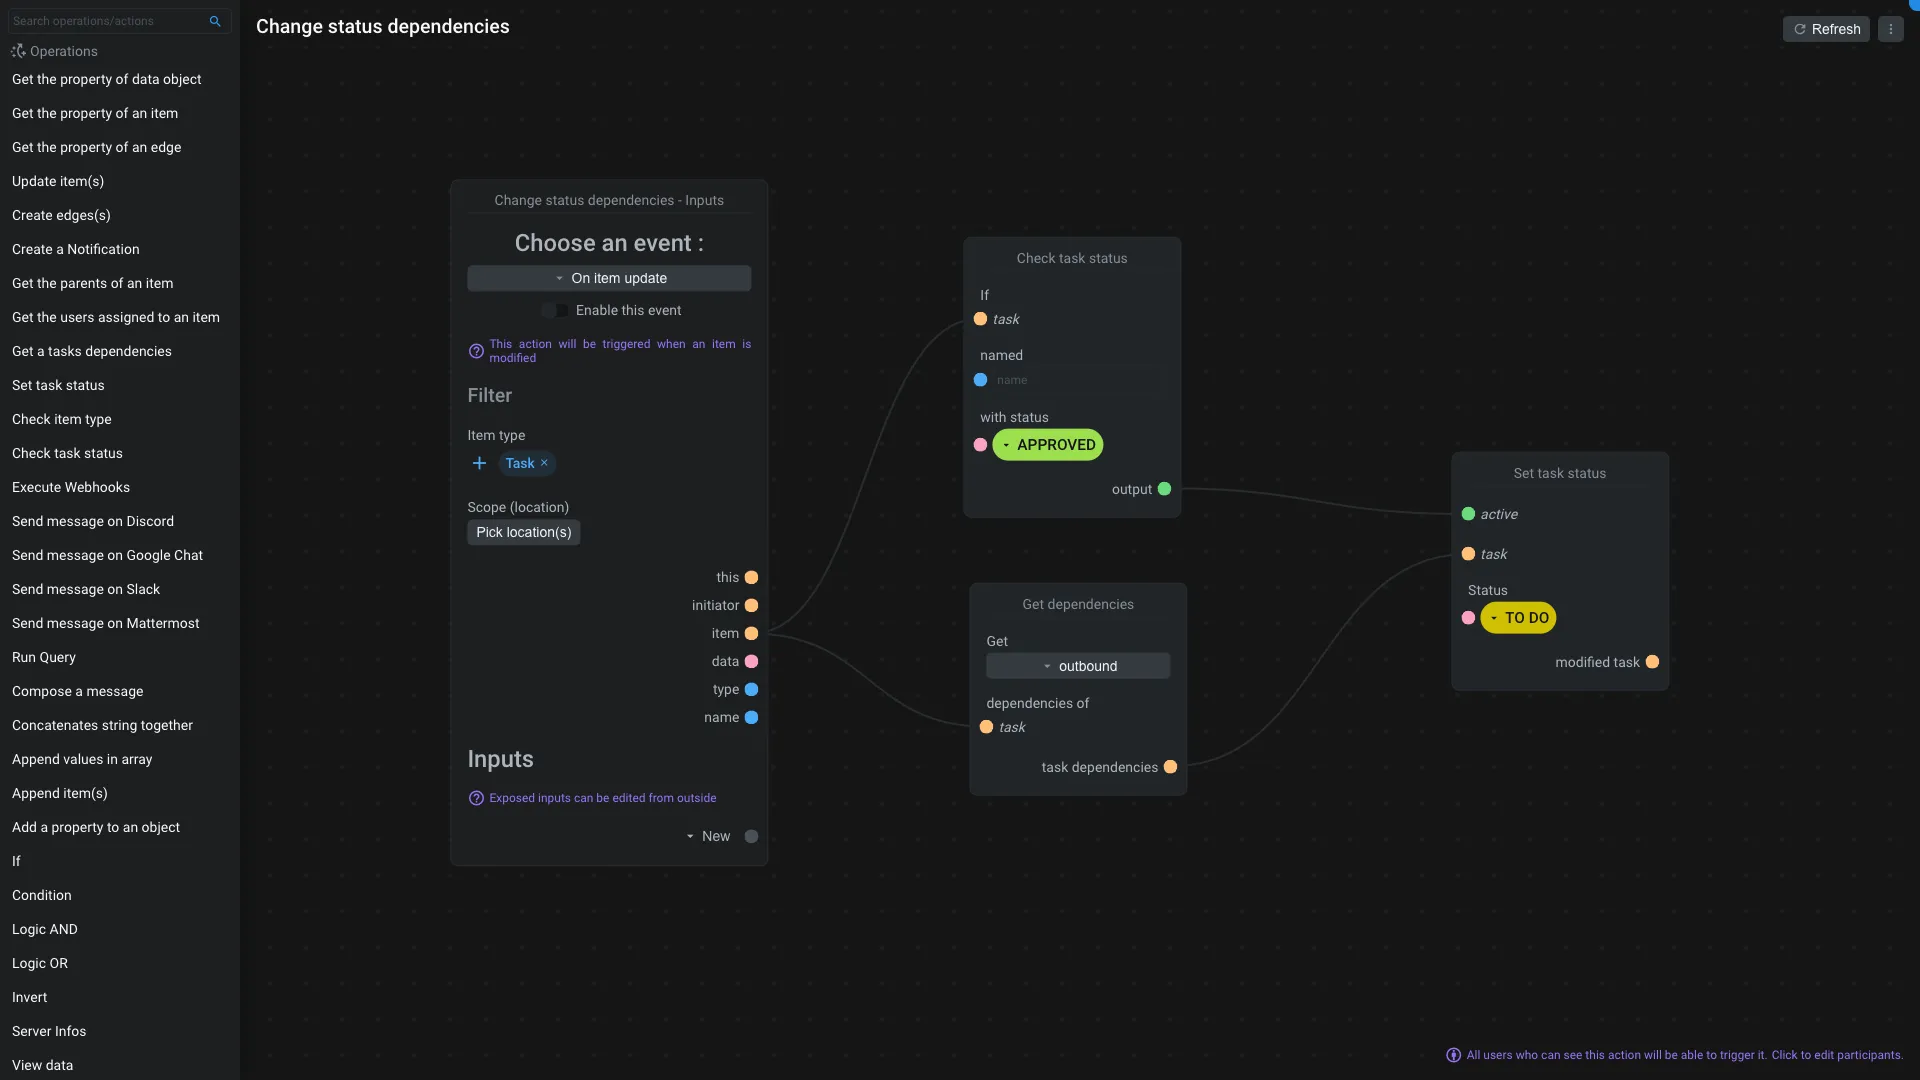
Action interface
In this nodal interface you can see your Action and the operations. Each node have its specific interface and you can configure it by clicking on their options.
You can see that some nodes have inputs and outputs of different colors. Each color represents a type of data :
- In yellow, it's for items entity
- In blue, it's for text
- In pink, it's for objects
- In violet, it's for array
- In green, it's for booleans
- In grey, it's a neutral input/output. It's like a "dynamic type" based
You can only connects input to output of the same color. Except for neutral inputs/outputs, they can be connected to any other type.
There is a special operator called Viewer that you can use to debug your action and operations.
Permissions
To allow users to trigger the action, they need to, at least, have the Read permission.
If a user doesn't have the Read permission, the action will not be triggered by the user's events.
You can edit the action permission by click on the violet mention Click to edit participants at the bottom of the interface. It will open the Quickeditor.
Debugging
When working on an action that doesn't work as expected, you can enable Debug mode in the top right corner of the interface. The debug mode is enabled until the action is executed successfully or until an error occurs.
To visualize a log from a previous execution, you can press the d key on your keyboard to open the latest debug log, or select the one you want from the Execution history section under the nodal interface.
When a log is selected, you can see a new Debug lens node appearing in the interface. You can also press the d key to move the debug lens in the center of the interface and easily see it on your screen.
The Debug lens is displaying the information about the last execution (executation date, who triggered it and how long it took to execute). It's also showing you node's outputs of the selected node. A node where you can see a log is outlined in orange.
Instead of selecting nodes, you can also drag and drop the Debug lens onto any node to see its outputs.
In case of an error occured, the node that caused the error will be outlined in red. So you can easily identify where in the action the error occurred and wich node caused it. The error message will be displayed in the Debug lens as well.
If you want to see all the outputs of all nodes, you can double click on the Debug lens.
From the execution history, you can also requeue an event with debug enabled. So you can replay the event and see how it will be executed with the current action configuration. This is useful to test your action without having to trigger it manually.
When requeuing an event, all the actions that are listening to the same event will be executed. So be careful when requeuing an event, especially if you have multiple actions listening to the same event.
When you are done with a log, you can close it by clicking on the x in the execution history header or by selecting another execution history entry associated with no other logs.
You can also clear a log from the execution history by clicking on the icon menu and Clear debug log.