Grafana
Aquarium is compatible with Grafana. You can monitor your Aquarium's instances using Grafana, but also Prometheus or any platform compatible with OpenMetrics.
Start easily using Grafana Cloud. Grafana Cloud is a fully managed, cloud-hosted observability platform that's ideal for those eager to get started without installation hassle. Their free tier is enought to monitor your Aquarium's instances.
Requirements
Aquarium provide a dedicated endpoint to provide access to the metrics. This endpoint is not enabled by default. Check your server settings or contact our support to enable it. To check if the metrics are enabled, you can go to the Admin panel > Monitor > Metrics section.
This endpoint requires a valid authentication token. The best is to use a dedicated Bot for that purpose.
Configuration
Bot creation
- Go to the
Admin panel>Botssection. - Click on the top right button
Create botand name your bot. UseGrafanafor example. - Unfold the new bot and click on the + next to
Manage tokensbutton. - Fill the form with the following information:
Name: The name of the token. UseGrafanafor example.Expiration: Choose a reasonable expiration date.
- The token is automatically copied to your clipboard. Store it in a safe place for using it in the next step.
The bot doesn't need any specific permission.
Grafana Cloud
Grafana provide a dedicated guide to configure the metrics endpoint.
- In your Grafana Cloud stack, click
Connections>Add new connectionin the left-hand menu. - Find and select the
Metrics Endpointtile to open the integration. - Review the prerequisites on the Configuration page
- Click on the top right button
Add a new scrape job. - Fill the form with the following information:
Job name: The name of the job.Scrape Job URL: The metrics endpoint URL, that you can find in theAdmin panel>Monitor>Metricssection.Scrape interval: Every minutes is a great start.Type of Authentication Credentials: ChooseBearerand paste the bot token you generated in the previous step.
- Once scrape jobs is configured and tested, metrics will automatically appear in your Grafana.
Dashboards
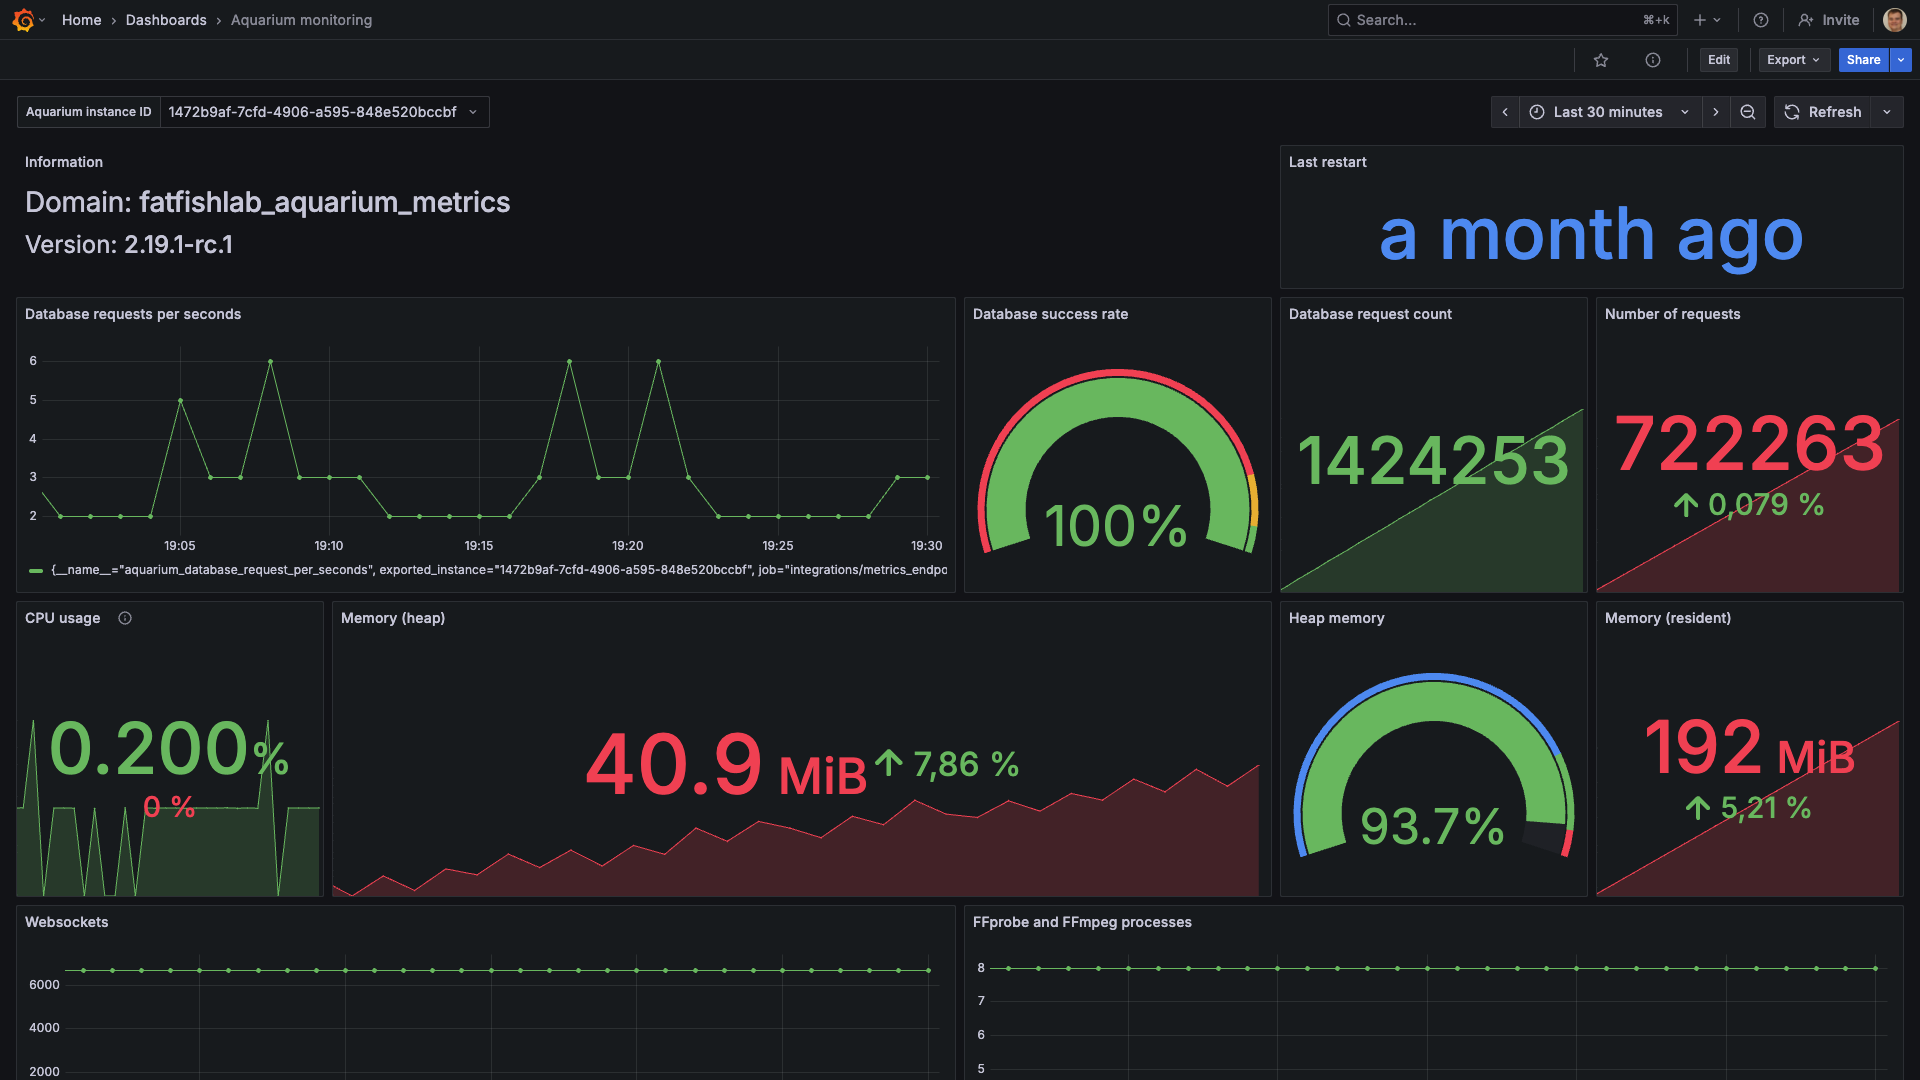
You can either create your own dashboards to monitor your Aquarium's instances, or use the dedicated dashboard we created for Aquarium.
Click here to download the Fatfish Lab's dashboard.